


The Australian dollar is starting the week on the back foot after its weakest performance in six weeks against the US dollar. With trimmed mean CPI due mid-week, fading USD momentum, and Wall Street still holding key supports, AUD/USD is primed for a volatility spike after last week’s sharp selloff. The outlook hinges on two forces: another firm Australian inflation print, and whether US markets can stabilise after a jump in the US Dollar Index and rising Treasury yields.
View related analysis:
- Australian Dollar Outlook: AUD/USD Breakout, AUD/JPY Mean Reversion?
- US Dollar Eyes Breakout, USD/JPY Targets Jan High on Hawkish FOMC Mins
- Nasdaq Leads Wall Street Lower: Tesla Turns, Apple Sours
- ASX 200 Market Wrap: Big Four Bounce, FMG Surges, CSL Lags
Australian Dollar Performance
- The Australian dollar was the second weakest FX major against the US dollar last week, with the bearish engulfing week on AUD/USD marking its worst week in six
- While the Aussie was flat against the yen last week, AUD/JPY fell for a second day on Friday in line with my near-term bearish bias, and met its initial downside target around the 20-day EMA (100.48)
- It also remained flat against the New Zealand dollar ahead of this week’s RBNZ meeting, though its bullish trend structure and potential for a dovish 25bp cut likely means pullbacks are to remain limited for now
- AUD/CAD has remained within a sideways range between 0.905 – 0.920 over the past 10 weeks, though momentum turned higher form the range lows on Friday
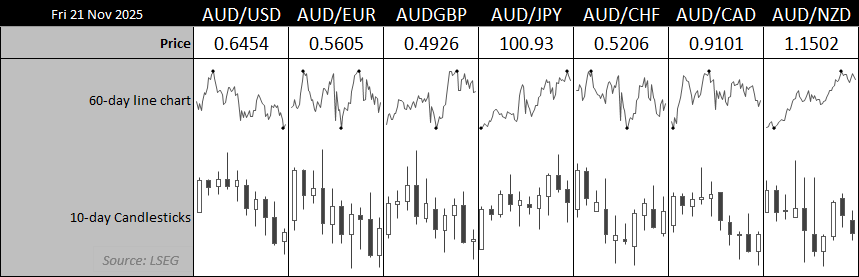
Chart prepared by Matt Simpson - Source: LSEG
US Dollar Index Extends Higher as Fed-Cut Bets Fade
The US Dollar Index logged its highest weekly close in 27 weeks as traders further pared back expectations of Fed cuts. A solid NFP print, combined with higher participation, was enough for markets to overlook the slight rise in unemployment to 4.4%. FOMC minutes had already cooled hopes of a December cut, and the jobs data helped push the dollar to a fresh cycle high.
That said, US consumer confidence remains soft and inflation expectations fell in the latest University of Michigan survey. Traders will now turn to the Conference Board’s sentiment report — alongside US GDP, producer prices and PCE inflation — although expectations for near-term Fed cuts remain limited.
Note that US Thanksgiving is likely to deliver very narrow ranges on Friday, with the potential for some last-minute moves — and therefore choppy, unreliable price action — on Thursday.
Trimmed Mean CPI Takes Centre Stage for AUD/USD
Trimmed mean CPI is the key data point for AUD/USD traders this week. While the RBA focuses primarily on the quarterly release, the ABS will publish the October monthly indicator — the first read of Q4. This will shape expectations ahead of the January quarterly print, but it would take an unexpectedly soft result to revive hopes of an RBA cut given the strength of Q3 inflation. A firm print would further diminish the chances of even a single cut in 2026, and could lift speculation of a hike — though that is not my base case at this stage.

Chart prepared by Matt Simpson - Source: ABS, LSEG
Australia This Week: Economic Data and Events for AUD/USD Traders
|
Date |
AEDT (GMT +11) |
Event |
|
Tue 25 Nov |
08:45 |
NZ |
|
Wed 26 Nov |
00:15 |
US ADP Employment Change Weekly |
|
|
00:30 |
US Core PPI (Sep), Retail Sales (Sep) |
|
|
02:00 |
US Consumer Confidence (Nov) |
|
|
11:30 |
AU Monthly Trimmed Mean CPI (Oct) |
|
|
12:00 |
NZ RBNZ Interest Rate Decision, MPS (-25bp exp) |
|
|
13:00 |
NZ RBN Press Conference |
|
Thu 27 Nov |
00:30 |
US GDP, PCE Prices (Q3) |
|
|
02:00 |
US Core PCE Price Index, Personal Income (Sep) |
|
|
08:45 |
NZ Retail Sales (Q3) |
|
|
11:00 |
NZ NBNZ Business Confidence |
|
|
11:30 |
AU Capex (Q3) |
|
|
12:30 |
CN Industrial profit (Oct) |
|
Fri 28 Nov |
22:30 |
US Thanksgiving Day |
|
|
11:30 |
AU Housing Credit (Oct) |
AUD/USD Correlations
- US markets remain the key driver of the Australian dollar, with the 20-day correlation between the US Dollar Index and AUD/USD at -0.8 and the 10-day at -0.91.
- Risk appetite — or the lack of it — from Wall Street is also steering the Aussie, with the 10-day correlation at 0.94 with the S&P 500 and 0.88 with the Dow Jones.
- This inverted correlation with the dollar, combined with a strong positive link to risk, has kept AUD/USD tightly aligned with the New Zealand dollar, reflected in a 10-day correlation of 0.95 and a 20-day reading of 0.89.
- China’s influence on the Aussie has faded, with the 20-day yuan correlation sitting at a negligible 0.14 and a still-weak 10-day correlation of 0.5.

Chart prepared by Matt Simpson - Source: LSEG
AUD/USD Technical Analysis: Australian Dollar vs US Dollar
Given AUD/USD is taking its cue from the US dollar and broader risk sentiment, it’s worth noting that Wall Street indices are still holding above support and bullish momentum in the USD is fading. AUD/USD also printed a small bullish bar on Friday after a sharp two-day selloff, which hints at a minor bounce early in the week before bears potentially re-enter.
Even so, recent momentum suggests the Aussie wants to at least probe the 0.6400 level. Whether it breaks below or instead produces a stronger reversal will likely depend on how US markets trade. And if my view is correct that Australia is set to post another firm inflation print on Wednesday, downside could be limited — with scope for a bounce from 64c if risk appetite improves on Wall Street.
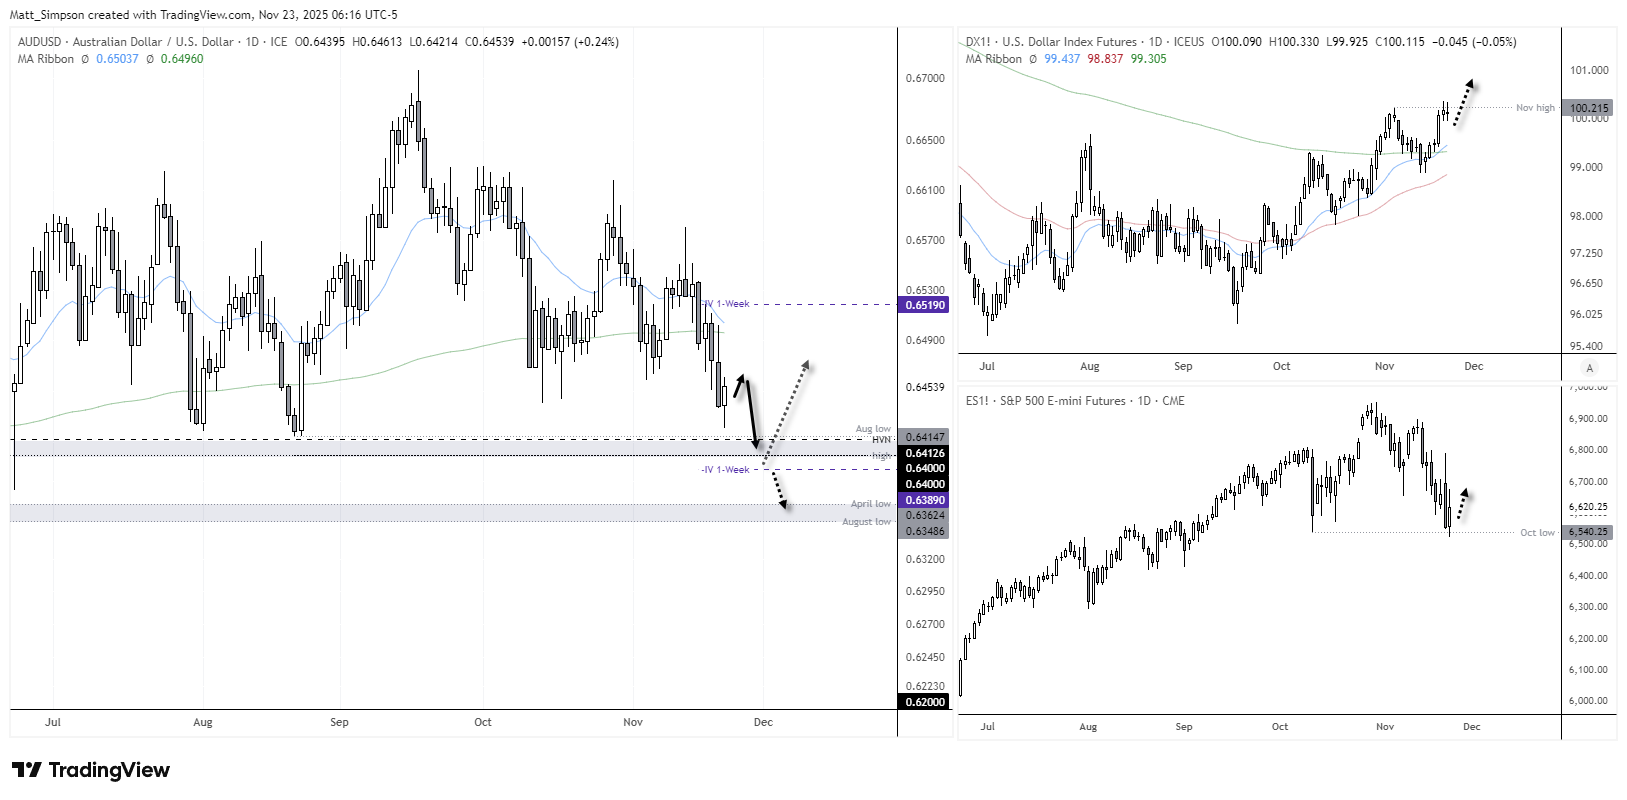
![]() Chart analysis by Matt Simpson - data source: TradingView AUD/USD
Chart analysis by Matt Simpson - data source: TradingView AUD/USD
View the full economic calendar
-- Written by Matt Simpson
Follow Matt on Twitter @cLeverEdge
How to trade with City Index
You can trade with City Index by following these four easy steps:
- Open an account, or log in if you’re already a customer
• Open an account in the UK
• Open an account in Australia
• Open an account in Singapore
- Search for the market you want to trade in our award-winning platform
- Choose your position and size, and your stop and limit levels
- Place the trade


